Overview
Google Analytics is a web analytics service offered by Google and is the industry standard for tracking, analyzing and reporting website traffic. Using Google Analytics can help you measure site traffic, SEO, engagement, ad revenue, and activity on social media. You can also track goals (like driving visitors to a certain page or hitting conversion points), follow the paths of your visitors, or see how people interact with a page in real time. In a nutshell, it helps you understand where an individual visitor came from, how they found you, what they did on your site, how engaging they found your content to be, and how they left your site.
Logging into Google Analytics
To view your site’s Google Analytics, you need to a have a Google-based email address added to your Google Analytics account. If your email account has already been added, you may click on the link below to access your stats.
https://analytics.google.com/analytics/web/
Please note: if you are not logged into your gmail account, you’ll be asked to login to the email account linked to your Google Analytics account. If you are unable to view your stats, please contact us and we will make sure you are set up.
Understanding Your Google Dashboard
Google Analytics provides a dashboard view of your important data – this screen gives an overview of the important statistics. The following is a brief description of each component.
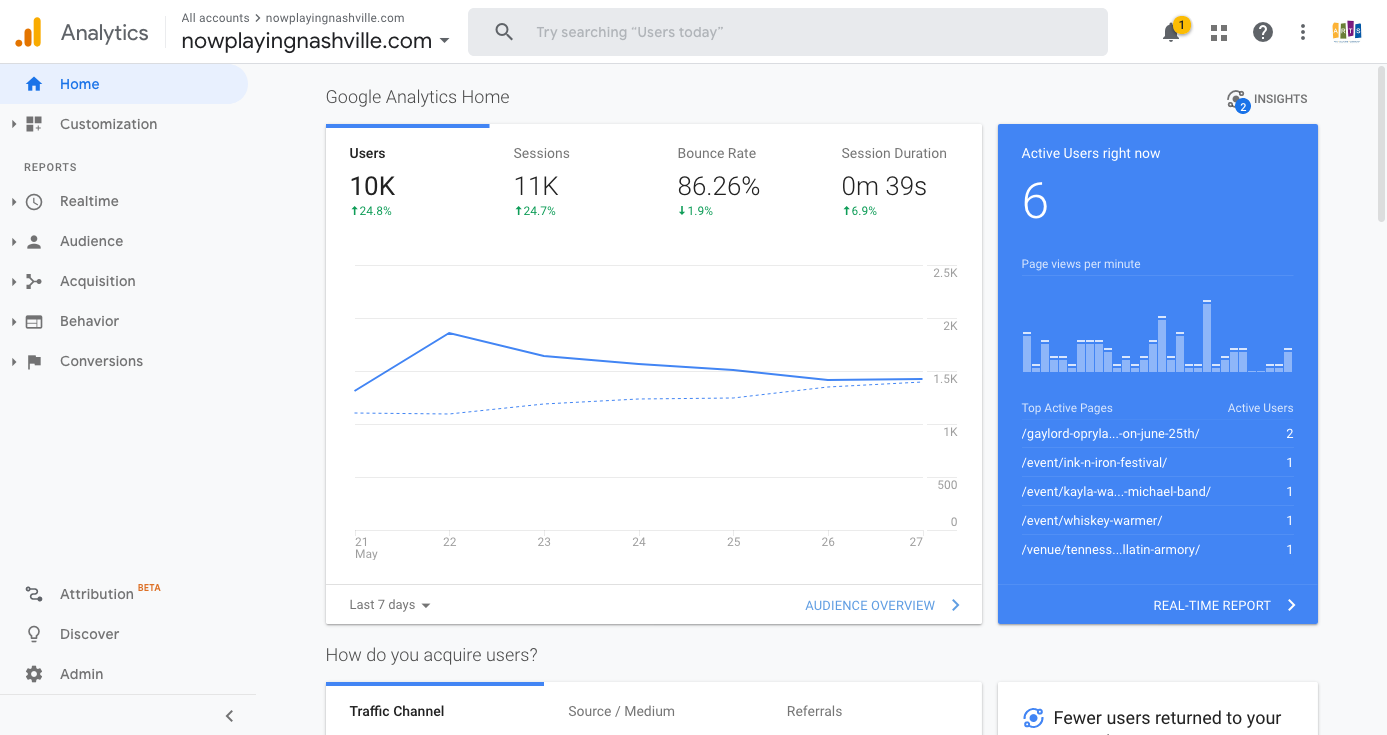
Real-Time Reporting helps you monitor activity on your site or app. These reports are updated continuously and every interaction with your site is recorded just seconds after it occurs. Real-Time reporting helps you view location information, traffic sources, how many people are currently on your site, which pages they’re interacting with, and conversion goal information.
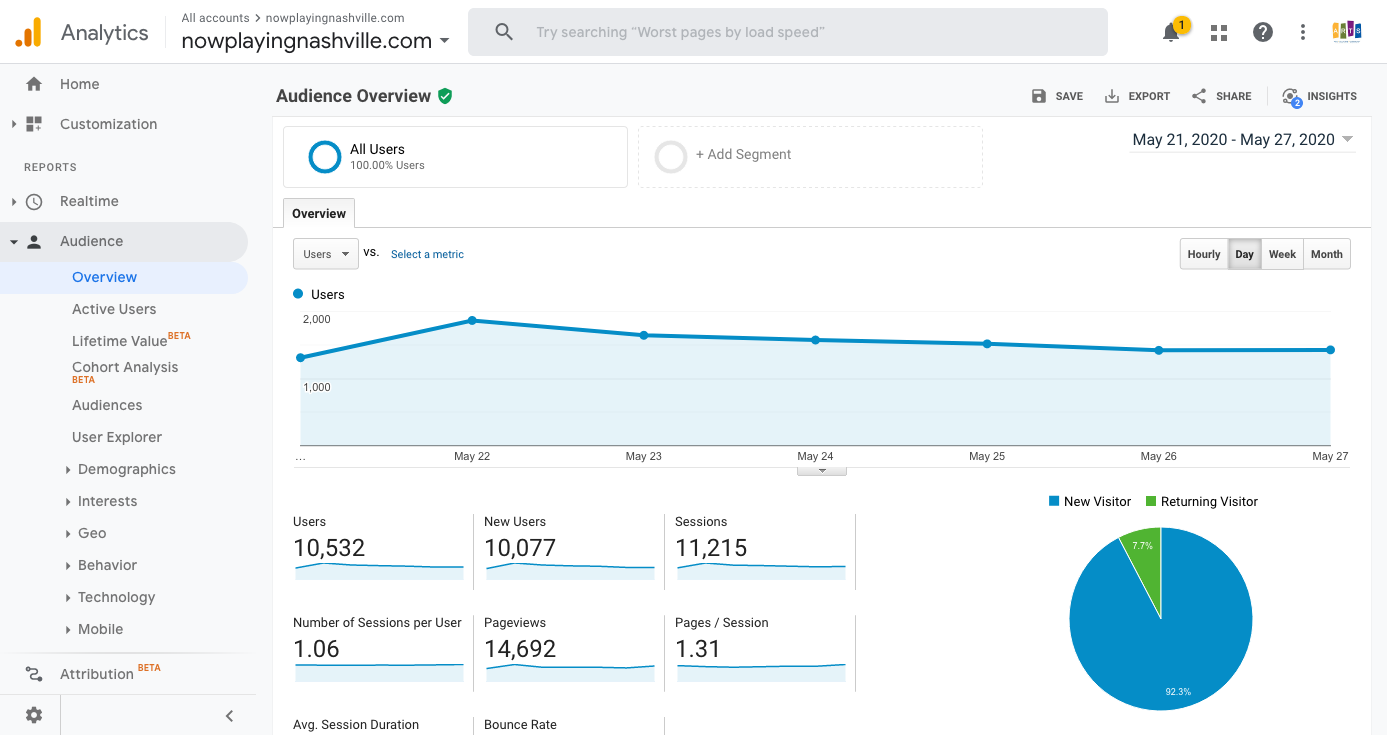
Audience (as shown above) reports provide insight into characteristics of your users, including but not limited, to the following:
- Overview – This report has 8 key indicators. These indicators appear in almost all reports so once you understand these you’ll be able to grasp what is being displayed in each report.
- Users: Users refer to a single visit by an individual. If that individual leaves the site and returns within 30 minutes, this is still seen as 1 visit.
- New Users: A new user is one who is visiting your site for the first time (during a specific period). To cross-reference this you could take a look at the New vs Returning Visitors report.
- Sessions: A session is the number of visits overall during a specific period. This includes multiple visits by the same visitor (on the same device). If a user leaves the site and returns after 30 minutes this is seen as an additional session, but not as an additional user.
- Number of sessions per user: This refers to the average number of sessions per user.
- Page Views: Page views refer to the total number of pages viewed overall for all visits, including multiple visits to the page by the same visitor.
- Pages/Sessions: Pages per session refer to the average number of pages each visitor views per session, this includes repeat visits to a page.
- Avg Session Duration: Average session duration refers to the average time a visitor spent on the site during each session. However, since it is simply an ‘average’ it can be confusing to some website owners, as some visitors will be on a site for minutes, whilst others may stay for only 30 seconds. Don’t confuse this with actual session duration which can be found by digging deeper into behavior reports.
- Bounce Rate: Bounce rate refers to a visitor who visits only 1 page on your website and then leaves without viewing another page. All websites will have some percentage of bounce rate.
- Active Users – Track active users for increments of 1, 7, 14, and 30 days, and stay abreast of the level of user enthusiasm for your site or app.
- Cohort Analysis – A cohort is a group of users who share a common characteristic that is identified in this report by an Analytics dimension. For example, all users with the same Acquisition Date belong to the same cohort. The Cohort Analysis report lets you isolate and analyze cohort behavior.
- User Explorer – Isolate and examine individual rather than aggregate user behavior. Individual user behavior is associated with either Client-ID or User-ID.
- Demographics (Age, Gender) – Understanding the age-and-gender composition of your audience gives you an opportunity to precisely tailor your content and advertising, from the graphics, language, and technical sophistication you employ on your site to the creative contents and placements for your ads. Learn more.
- Geo (Language, Location) – It’s important to know whether you’re getting a response from users to whom you direct different language versions of your advertising, but you also want to know what kind of traffic you’re getting from users outside those targets. Maybe you’re advertising in English and Spanish, but also getting high-conversion users who speak French and Italian, indicating an opportunity to localize your ads to those languages and speak more directly to a lucrative market. You want information from the areas you already target in your advertising, but you should also know about traffic from other geographic areas whose users exhibit a natural interest in your products.
- Behavior (New vs. Returning, Frequency & Recency, Engagement) – Measure the gravitational pull of your site, and the extent to which you’re encouraging first-time users to return. You can also see the economic impact of new vs. returning users (e.g., the 30% of users who are returning account for 45% of total transactions).
- Technology (Browser & OS, Network) – Understanding the technologies users employ to reach and consume your content lets you fine tune current versions, and plan upcoming implementations. For example, you want to be sure your site is fully functional in current browsers, but you also want to stay abreast of the extent to which users are migrating away from desktop to mobile browsers and apps, and plan your development accordingly.
- Mobile (Devices) – See which mobile devices are being used to interact with your content.
- Custom (Custom Variables, User Defined) – You can use Custom Variables to extend the scope of your Segments. User-level custom variables let you identify users by aggregate behavior over a date range rather than by discrete, single-session interactions with your site.
- Benchmarking – Benchmarking allows you to compare your data with aggregated industry data from other companies who share their data. This provides valuable context, helping you to set meaningful targets, gain insight into trends occurring across your industry, and find out how you are doing compared to your competition.
- Users Flow – Users Flow is a graphical representation of the paths users took through your site, from the source, through the various pages, and where along their paths they exited your site.
Acquisition provides a snapshot of what Google calls the “Acquisition-Behavior-Conversion (ABC) Cycle.” Basically, this displays where users come from, what they do on your site once they arrive and if they provide a conversion (filling out a form, making a purchase or completing a goal).
Behavior report visualizes the path users traveled from one page or Event to the next. This report can help you discover what content keeps users engaged with your site. The Behavior Flow report can also help identify potential content issues.
Conversions shows you the path your customers take on your website, from the entrance to making a purchase or becoming a lead.
How To Use the Data
Look at the trends, not the numbers. Don’t get bogged down with the numbers, instead look at the trends. The number of visitors to your site will vary widely from hour to hour and day to day. But over time, you will be able to see trends emerging. Most importantly, are your site visitor numbers steadily growing from month to month?
Focus your efforts. If your website is not as successful as you would like it to be, then it’s usually for one of two reasons: not enough visitors, or visitors not acting as you would wish… or both. Your analytics can help you to determine the problem.
For example, if you are only getting a handful of visitors to your website each month, then you should focus your efforts on driving people to your site. This might include search engine optimization, online advertising, and being creative.
Review and adapt. Use your statistics to determine which pages are working, which pages are not, and try to figure out why. Perhaps you are using better photos on one page, or another page reinforces certain keywords?
Google Analytics and Site Migrations
In general, whenever a site moves from one platform to another and page structure changes, Google will perceive the site as almost a completely new site. With our platform upgrade most of the code changed, including the image paths. Image searches specifically can drive a lot of traffic from Google, so when those paths change (which they needed to in this case), Google will need to re-index all of them. As a result, the site may lose ranking over the short term, but over the course of a month or so it should pick back up to normal.
Questions or suggestions? Contact: networksupport@artsopolis.com